Separate a claim from an estimate
A citation gives a claim somewhere to point. To decide whether it supports the claim, ask what comparison would have to be true. A statement about differences between groups and a statement about what would happen after changing care can sound similar while requiring different evidence. The scientific task is to identify the change being proposed before deciding which estimate could answer it.
Consider the proposition that preventing a digestive symptom would preserve a desired weight outcome. Testing that proposition would require a defined prevention strategy and an outcome under an alternative strategy. Sorting observations by whether a symptom occurred asks a different question. Even perfect measurement of that sorting would not, on its own, specify what prevention would do.
A useful reading method separates the outcome, the comparison and the proposed action. Write each in a sentence with its own subject. Then look for a step that changes the question without supplying new evidence. This makes the disagreement testable: which additional comparison would connect the recorded outcome to the action someone wants to recommend?
Name the comparison before the number
SURMOUNT-1 randomized adults with obesity or overweight without diabetes to weekly subcutaneous tirzepatide or placebo for 72 weeks.[2]
An effect estimate needs a target population as well as a treatment label. Suppose a proposed claim concerns a population defined by different eligibility rules. To extend an estimate, a reader would need to consider whether characteristics relevant to the contrast are represented and whether their distribution matters. Sharing a diagnosis or a product name would not establish that match. The task is to specify which differences could change the answer, then seek information about them. A transport check should also identify where the target population has no corresponding observations. Reweighting can change the importance assigned to represented characteristics; it cannot create information about a combination that was never represented.
Random assignment can support a comparison between assigned strategies because the allocation procedure does not deliberately sort people by their expected outcomes. That protection attaches to the assignment being evaluated. A later classification requires its own explanation. When assessing any such classification, ask whether group membership could depend on characteristics related to the outcome, and whether those characteristics existed before assignment or developed afterward.
Time belongs in the question too. An outcome defined at a particular visit cannot automatically answer a question about an earlier trajectory or an enduring effect afterward. A proposed extension therefore needs an observation schedule, not merely a longer sounding conclusion. To practice a different question about what an endpoint represents, read the companion study analysis. Keeping the population, strategy, outcome and time together prevents a seemingly small change in wording from silently creating a different scientific claim.
Examine membership and selection
Post hoc NVD groups were not randomized; one event qualified. Endpoint weight was required; data after treatment discontinuation were excluded.[1]
Construct a hypothetical explanation before choosing an adjustment. Suppose an unmeasured baseline characteristic influenced both the likelihood of recording a symptom and the eventual weight outcome. Grouping on the symptom could then sort people partly by that characteristic. The resulting contrast could contain both the relationship of interest and the influence of the shared cause. This is a possible structure to investigate, not a finding that any particular imbalance occurred.
Now add continued observation to that hypothetical structure. Imagine that both practical ability to attend visits and how someone feels affect whether an outcome is recorded. Restricting attention to available records could connect those influences within the selected group, even if they were unrelated beforehand. Adjustment for baseline measurements would not automatically remove a connection created by later selection. A defensible analysis would identify each proposed selection mechanism and explain which information could distinguish it from competing explanations.
Translate this reasoning into an audit of records. A participant identifier, visit time, treatment status and outcome availability answer different questions. A rule that excludes some visits need not remove every record for the same person; a rule that requires a particular visit can select people differently again. Count eligible records and eligible people separately before interpreting a missing row. This distinction also identifies the right sensitivity exercise: changing a visit rule and changing a participant rule are separate alterations, so they should not be combined and described as one test of robustness.
Read the model estimates
A least-squares mean can be understood as a summary constructed from model predictions under a specified reference pattern. A raw mean, by contrast, directly averages observed values. To interpret a model summary, ask which characteristics enter the prediction, where those characteristics are held or averaged, and how the reference population is defined. Those questions concern the meaning of the number before they concern whether its magnitude is impressive.
The choice of reference pattern can matter when relationships vary across characteristics. Suppose a hypothetical model allowed a group contrast to differ by a baseline measurement. Averaging over one distribution of that measurement could produce a different summary from averaging over another. Neither result would be self-explanatory without its reference distribution. A useful model report would therefore make the averaging rule reproducible and distinguish a comparison at fixed characteristics from a comparison averaged over people.
Read the outcome scale separately from the model. A percentage change expresses change relative to an initial quantity. A difference between percentage changes has percentage-point units; it is not another percentage change obtained merely by renaming the subtraction. Likewise, subtracting two displayed estimates supplies an arithmetic contrast, but evaluating that contrast requires the model and its uncertainty. To answer a treatment-versus-control question, a reader would need the corresponding treatment-versus-control comparison. A coordinate on a chart cannot supply an alternative outcome that was never included in that calculation. There is another distinction worth checking: the average of individual percentage changes need not equal the percentage change calculated from two group averages. Different initial weights can give those calculations different weighting. A clear outcome definition prevents an analyst from substituting one calculation for the other merely because both carry a percent sign.
Reading the estimates
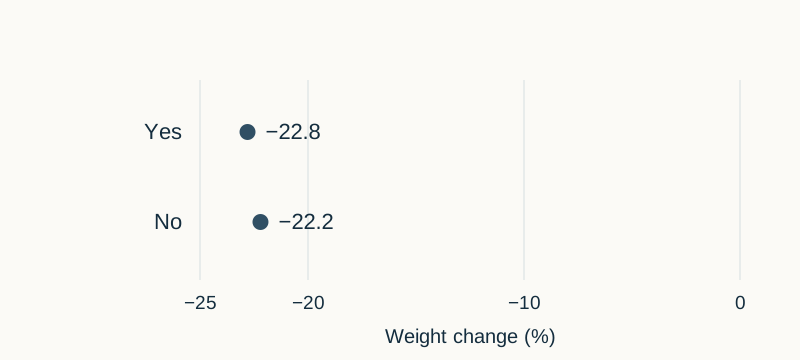
| NVD | Change (%) |
|---|---|
| Yes | −22.8 |
| No | −22.2 |
Ask what precision would need to show
Precision is a property of an estimate under an analysis, not a visual impression of how close two marks appear. Start by specifying the contrast whose precision matters. A claim about a difference, a claim about a clinically acceptable loss and a claim about equivalence use different decision rules. Choosing among them after seeing an attractive picture would make the conclusion depend on the presentation rather than on a previously defined question.
Uncertainty about separate means also differs from uncertainty about their difference. If the estimates share data or fitted parameters, their errors may move together. The variance of a difference depends on both component variances and their covariance. Ignoring that relationship can produce the wrong uncertainty for the comparison. A reviewer should request the fitted contrast or enough model information to reproduce it, rather than constructing a confidence interval from the apparent spacing of points.
Equivalence adds a further requirement: a justified range of differences small enough for the intended decision. That range must be chosen independently of the observed estimates and expressed on the correct outcome scale. An interval entirely within the range would address a different proposition from an interval that merely includes no difference. An imprecise result can fail to distinguish groups while remaining compatible with consequential differences. Conversely, a precise but tiny difference could be statistically detectable without settling whether it matters. These possibilities explain why the language of a conclusion should follow its decision rule, not just its sign.
Put time and burden back into the question
A binary category discards distinctions by design. Consider two hypothetical collections of records: one contains brief isolated episodes, while the other contains repeated episodes spread across observation. A rule that records only whether any episode occurred could put both collections in the same category. This demonstration does not reconstruct anyone's experience. It shows why answering a question about burden would require a definition of burden and records capable of measuring it.
Possible burden measures include time affected, recurrence or interference with activities. Each chooses a different aspect of experience. Before combining them, specify whether an improvement in one could compensate for deterioration in another. Without that decision, a composite could conceal changes that move in opposite directions. A proposed analysis should also distinguish the timing of an event from the timing of its report; delayed reporting can complicate the order in which measured variables appear to change.
For a causal question, the relevant order is especially important. A later event cannot explain an earlier outcome change through a pathway that requires the event to come first. A future investigation could align repeated symptom assessments and weight measurements, define the time interval over which a relationship is expected, and test alternative intervals. It would still need to address shared causes and changes in observation. A finer calendar can make a proposed explanation more testable, but temporal detail alone does not identify that explanation as the correct one. The schedule should be chosen to distinguish the proposed temporal explanations. Measuring more often is useful only if the additional observations can resolve a relevant order, interval or change that the broader schedule would leave ambiguous.
Test the counterfactual step
Define the counterfactual as a policy someone could actually follow in a study. Preventing an event through one strategy may not have the same consequences as preventing it through another. For a proposed symptom-management trial, the strategy would need an explicit start rule, eligible population, comparison condition and follow-up plan. The scientific intervention is that specified strategy, not the instruction to imagine the same people with a symptom simply erased.
Randomizing eligible participants to alternative management strategies could address the total effect of those strategies. Separating a symptom pathway from other pathways would require more. For example, suppose a hypothetical strategy also changed eating behavior or the likelihood of attending follow-up. An outcome difference could then reflect those changes as well as any symptom change. Measuring the additional pathways would make explanations more examinable, but measuring them would not automatically justify adjusting them away. Adjustment could remove part of the effect the policy question was meant to include.
Prespecify symptom and weight outcomes separately, along with the time at which each is assessed. A strategy might meet a symptom objective without meeting a weight objective, or the reverse. The study should state how that combination would be interpreted before results arrive. This also provides a practical test when reading an add-on claim: does its evidence evaluate the proposed strategy, population and objectives together? The guide to how to read online medication reviews offers another place to organize that question without substituting a provider description for an intervention comparison.
Challenge the measurement rule
A measurement rule should be specific enough that another analyst could apply it without guessing. For a proposed symptom analysis, define what qualifies as an episode, how overlapping reports are handled, and which time window determines membership. Then identify plausible alternative rules that answer recognizably similar questions. Changing the outcome itself and changing only an uncertain classification detail should be reported separately; they test different kinds of dependence.
One sensitivity exercise could vary the reporting threshold while holding the comparison and follow-up window fixed. Another could examine different assumptions about unavailable outcomes. For the latter, state how missing values would have to differ from observed values for the conclusion to change. The purpose is not to select whichever assumption preserves a preferred result. It is to locate the point at which an inference depends on information the available observations cannot settle.
Keep these exercises organized by the problem they address. Reclassifying events probes measurement choices; changing assumptions about unavailable outcomes probes observation; varying an adjustment set probes a model's dependence on specified covariates. Agreement across several analyses would be informative only if the alternatives were credible and genuinely tested different vulnerabilities. Analyses that share the same unexamined assumption could agree for the same reason. A sensitivity report should therefore name the assumptions it varies and the assumptions it leaves intact, allowing readers to judge the remaining uncertainty instead of treating a collection of similar estimates as a guarantee.
Make the inference auditable
Lilly funded this analysis; six authors disclosed employment and shareholding.[1]
A financial disclosure identifies a relationship that readers should consider when assessing how work was produced. It does not determine the validity of a particular estimate. To evaluate that estimate, request a reproducible chain from the stated question to the eligible records, model specification, fitted contrast and reported uncertainty. The chain should make discretionary choices visible, including when they were made and whether alternatives were examined.
A useful audit package would separate the original analysis instructions from later amendments and explain which outputs each version generated. That makes it possible to distinguish a planned test from a question raised by observing results. It also permits a reviewer to investigate discrepancies without guessing at motive. For a separate service-documentation task, the Elm Health review is a reading destination. Keep such a review separate from the statistical question: evidence about an outcome cannot establish a service's performance unless the service and the relevant comparison are actually evaluated.
Keep symptoms out of efficacy targets
Zepbound delays gastric emptying and is not recommended with severe gastroparesis. Contraindications include personal or family medullary thyroid carcinoma history, multiple endocrine neoplasia type 2, and serious tirzepatide or ingredient hypersensitivity. Persistent or severe abdominal pain needs prompt assessment; gastrointestinal dehydration can damage kidneys.[3]
Compounded products lack FDA approval.[4]
A population estimate cannot decide what a particular person should endure. Scientific interpretation and clinical assessment have different tasks: one evaluates a comparison, while the other considers a person's circumstances and symptoms. A symptom should not be treated as an efficacy target or used as a personal test of whether care is working. The tirzepatide profile provides a separate reading route for product scope. Bring questions about care to a qualified clinician rather than translating a statistical comparison into a dose or symptom-management instruction.
Reader questions
Do close estimates establish equivalent outcomes?
No. Ask first what decision the proposed equivalence would permit. That decision determines the outcome scale and the range of differences that would be acceptable. The analysis then needs uncertainty for the specified contrast, judged against that range. An inability to detect a difference can arise from insufficient precision; it does not supply the affirmative evidence needed to place the contrast inside an independently justified equivalence range.
Does a symptom group identify who should aim to have symptoms?
No. A category describes how observations are sorted. Choosing a care strategy requires comparing outcomes under feasible alternatives, including outcomes that matter beyond weight. The useful question is therefore what strategy would improve the overall objective, for whom, and under which conditions. Turning category membership into something to pursue skips that comparison and leaves the costs of achieving membership outside the proposed decision.
How could a symptom-management claim be tested?
A future study could assign eligible participants to a clearly defined management strategy or a suitable comparison, then assess distinct symptom and weight objectives on a stated schedule. Its decision rule should address what happens if those objectives disagree. Follow-up procedures and handling of unavailable outcomes should be specified in advance. This would make the strategy's consequences testable without assuming that any observed change must operate through a single symptom pathway.
Editorial assessment
The most useful conclusion is a specification of the evidence needed for a decision. Start with a feasible management strategy, define the population and outcome horizon, and state which contrast would change the decision. Then separate uncertainty about measuring that contrast from uncertainty about interpreting it causally. A more precise association cannot repair an undefined intervention, while a well-defined intervention still requires an appropriate comparison and adequate observation. For an equivalence claim, add a justified margin and an analysis capable of placing the contrast relative to it. For a pathway claim, identify competing routes through which the strategy could affect the outcome and explain which assumptions distinguish them. These requirements make an ambitious claim examinable rather than merely cautious. Progress would consist of resolving a named uncertainty with the corresponding design or record, not collecting more similar-looking summaries and treating their agreement as a substitute for the missing comparison.
Limits of this analysis
This is an educational analysis of statistical reasoning, not an individual prediction or treatment plan. The hypothetical examples illustrate questions an analysis could address; they are not reconstructed participant histories. The discussion does not provide a personal dosing strategy or replace assessment of symptoms and care by a qualified clinician.
References
- Rubino (2025) · Diabetes Obes MetabSource checked 2026-10-28
- le Roux (2023) · ObesitySource checked 2026-10-28
- ZEPBOUND · NLMSource checked 2026-10-28
- FDA GLP-1 · FDASource checked 2026-10-28
Our methodology · Advertising disclosure · Request a correction